
VOL. 76, NO. 23
JOURNAL OF GEOPHYSICAL RESEARCH
AUGUST 10, 1971
Laboratory Simulation of Impact Cratering with High Explosives
VerneR. Oberbeck
Ames Research Center, NASA Moffett Field, California 94035
Impact and explosion craters have been formed at the same scale in the laboratory. Impact craters were produced with cylinders of aluminum of mass 0.4350 gram that were impacted with velocity of 2.0 km/sec and kinetic energy of 8.7 * 109 ergs against quartz-sand targets. Explosion craters were produced by detonating 0.150-gram charges of PETN high explosive yielding a chemical energy of 8,7 * 109 ergs at various depths beneath the target surface. Crater size and shape, ejecta-plume growth, and subsurface deformation have been determined. Measurements of cratering effects show that impact-crater formation can be simulated by detonation of the explosive placed at a depth of burst of 6.3 mm ± 2 mm (λ= 0.26 ± 0.10 for cube-root scaling). Caution should be used in applying these results to estimate kinetic energy of formation of large impact craters because knowledge of projectile velocity might be needed in addition to knowledge of crater size to estimate kinetic energy of formation of the crater using an explosion-crater analog.
The role of impact cratering in the production of lunar and planetary surface features has become apparent in recent years. Results of manned and unmanned lunar missions show that the surface of the moon is covered at each scale of examination by craters, many of which are impact craters. The earth has also been subjected to bombardment by extraterrestrial bodies that have produced large craters. Roots of these features arc preserved in terrestrial rock formations, especially in the older, stable shield areas of the earth. Mariner spacecraft photographs of Mars show that it, too, has been extensively cratered. Thus knowledge of the mechanics of formation and details of structures. of impact craters is of great importance in astrogeologic studies. However, there are few fresh terrestrial impact craters on the earth's surface. Therefore large chemical and nuclear explosion craters have been studied in the past as an aid to interpreting the mechanics of formation of impact craters. Kinetic energy of the body that produces a given impact crater has also been estimated from the chemical energy required to produce a given explosive-crater analog. Studies of this type usually imply that very shallow scaled depth of burst explosion craters are similar to craters formed by the impact process [Baldwin, 1903; Shoemaker, 1060].
While studies of large explosion craters have been of value for interpreting gross features of impact craters, the results are limited in their reliability. The lack of fresh impact structures impairs attempts to define features characteristic of large impact craters, and the conditions of formation of these craters are unknown. Deep structures beneath both impact and explosion craters can rarely be seen, and most natural-impact craters have been formed in target materials that are different from one another and from the material at the sites of the explosion craters that are used as analogs.
The objective of this study is to produce impact and explosive craters in the same target material under controlled laboratory conditions to determine the depth of burst that simulates impact. This approach has the advantage that large numbers of craters can be produced in identical targets for checks on reproducibility of results, and that detailed measurements of cratering effects can be made even in areas beneath the craters. The experimental results show that many of the effects of impact cratering at a given impact kinetic energy can be simulated by burial of an explosive at a specific depth of burst where the explosive-energy yield is equal to the impact kinetic energy, and the 5732 shock-wave detonation pressure is equal to the peak impact-shock-wave pressure.
Simulation of the Impact-Cratering Process with High Explosives
Baldwin [1963] provides a good review of the theory of simulation of impact-crater formation with high explosives. The main line of reasoning supporting the simulation is that at very high impact velocities the impacting body has kinetic energy/unit projectile mass equal to or greater than the energy content/unit mass of TNT. In addition, pressures and temperatures generated by impact are as high or higher than those occurring when explosives arc detonated. Kinetic energy is considered equal to explosion chemical energy. Cool; [1958] also states that for simulation of high-velocity impact, explosive chemical energy can be equated to impact kinetic energy. Baldwin concludes that simulation of the impact process with high explosives is valid if the dominant mode of energy transfer from projectile to target occurs by shock-wave formation. An example given of an impact that can be simulated by explosives is impact against the earth of a large body with impact velocity of about 9.6 km/see. As in most studies dealing with simulation of impact crater-ing with high explosives, control of chemical or nuclear energy and depth of burst is considered sufficient to simulate an impact event of the same energy level.
However, an impact-cratering study in sand [Braslau, 1970] shows that the projectile kinetic energy is partitioned to work to form the crater, to waste heat, to crushing of target material and to kinetic energy of the ejecta. Partitioning is controlled by shock-wave pressure, which is controlled by impact velocity. The size of a crater is a function of projectile kinetic energy and the fraction of projectile kinetic energy, depending on impact velocity, that is available for production of the cavity. This explains how different-size craters can be produced by projectiles with the same projectile kinetic energy but different impact velocities. Thus, in this study, impact velocity is controlled, and it is used to calculate the pressure amplitude of the shock wave produced in the target. The density of the explosive is selected to produce detonation-wave pressure equal to the pressure of the shock wave gen- erated by impact. This insures that partitioning of energy is as nearly equal as possible for both events. It is recognized that some of the chemical energy of the explosive is partitioned to an expanding gas ball that is never present during impact cratering, and there are other minor differences. However, if chemical and nuclear-explosion craters are to be used, as in the past, to simulate impact craters, control of impact velocity in addition to energy and depth of burst and detonation pressure of the explosive will insure that energy partitioning is as similar as possible for both events.
The velocity of the impact-cratering event simulated in this: study at a small scale was 2 km sec. There is no doubt that energy transfer is accomplished at this velocity and scale by formation of a shock wave in the target because calculations based on the equations of state of aluminum and quartz sand show that pressure developed behind the shock wave in sand is 83 kb. Energy content of the projectile was 1.97 x 10¹⁰ ergs/g, which is more than one-half the energy content/unit mass (3.87 * 1010 ergs/g) of TNT. The shock-wave pressure caused by detonation of the explosive used to simulate impact was 83 kb. Thus, conditions of this experiment satisfy Baldwin's criteria that energy transfer should occur by formation of a shock wave. An additional requirement, that energy partitioning should be as similar as possible for impact cratering and for explosion cratering, is insured by setting the shock-wave pressure equal for both events.
The energy content/unit mass of the projectile is only comparable to the energy content/unit mass of TNT. Impact of a projectile with higher energy content per unit mass and with velocity as high as 9.0 km/sec was not simulated because impact pressure of the shock wave produced in the sand under this condition would have been greater than 500 kb. The detonation pressure of PETN even at a high packing density of 1.6 g/cm3 is only of the order of 230 kb [Cook, 1958]. Thus it would have been impossible to simulate, even approximately, the pressures developed in the sand. This represents a typical difficulty encountered when attempts are made to reproduce both the energy content/unit projectile mass and target shock-wave pressure using high explosives. It was considered important to attempt to simu- late the shock-wave pressures in the target more accurately than the energy/unit mass of the projectile because of the great effect of impact velocity and target shock-wave pressure on impact-crater size.
Experimental Conditions
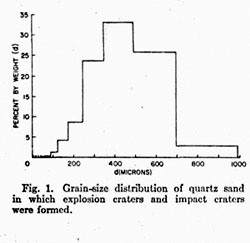
Impact craters and explosive craters were formed in quartz sand with grain-size distribution shown in Figure 1.
Craters were formed inside a chamber 2.4 meters in diameter and 3 meters in height that was evacuated to air pressure of 1 mm ± 0.5 mm. The chamber was large enough to prevent any of the material excavated from the target from being reflected off the chamber walls back into the crater. All targets were 100% quartz sand except for those used for study of subsurface deformation. These contained 0.16% by weight of powered epoxy resin.
Seven impact craters were formed in this simulation study. They were produced by cylinders of aluminum with mass = 0.4350 gram ЎА 0.020 gram that impacted the quartz sand at impact velocity of 2.00 km/sec ЎА 0.04 km/sec. Calculations using the equations of state of quartz sand, 2024 aluminum, and the impedance-match solution given in Van Theil et al. [1966] show that impact of 2024 aluminum in quartz sand at 2 km/sec produces a shock wave in the sand with pressure amplitude equal to 83 kb. The ratio of projectile diameter to projectile length was 0.80 and the projectile kinetic energy was 8.7 * 109 ergs ± 0.7 * 109 ergs. Six craters were produced in 60-cm-diameter cast-aluminum target containers that were 15 cm (Jeep. The crater formed for the study of subsurface deformation was produced in a 60-cm-square wooden box, 15 cm deep.
Cylindrical aluminum projectiles were launched in protective discs of plastic by a conventional powder gun similar to a high-powered rifle. This gun, mounted on a rail, can be rotated about the impact chamber. The protective plastic disc was slit at right angles in planes parallel to the longitudinal axis of the projectile so that spin imparted by the gun-barrel rifling separated the plastic pieces from the projectile after launch and laterally deflected them to a patching plate. After launch, the projectile entered the velocity chamber. A photodiode triggered a high-voltage spark that served as a light source to produce a shadowgraph of the projectile in flight. The high-voltage discharge triggered a time-interval meter, which recorded time elapsed since launch. Projectile positions were measured referenced to a fiducial bar, and differences in elapsed time after launch yielded estimates of impact velocities with accuracy of ЎА1%. All impact craters were formed with impact kinetic energy between 8,I x 109 ergs and 9,5 x 10⁹ ergs. Seven explosive craters were formed at each of four different shallow depths of. burst by using the high explosive pentaerythritol tetrani trate (PETN). The centers of the charge for each of the depths of burst less than 10, mm were 0 mm ЎА 1 mm, 3.2 mm ЎА 1 mm, 6.3 mm ЎА 1 mm, and 9.5 mm ЎА 1 mm. Four explosion craters each were formed at the depths of burst 14.3 mm ЎА 1 mm, 27.0 mm ЎА 1 mm, 39.7 mm ЎА 1 mm, 52.5 mm ЎА 1 mm, 05.2 mm ЎА 1 mm, and 77.8 mm ЎА 1 mm. All craters were produced in target containers similar to those described for the impact craters. Each of the cylindrical charges was 6.4 mm in diameter and 4.6 mm long, and detonation was initiated by high-voltage explosion of a bridge wire embedded in the explosive. Packing density of the explosive was 1 g/cm3. For the explosive PETN, this yields a detonation-wave pressure of 83 kb [Cook, 195S]. The weight of the charge was 0.150 gram for all craters. According to data given by Market al. [1965], the heat of detonation of PETN at a packing density of 1.7 g/cm3 is 1385 cal/g. The results of Cook [1958] show that this value is accurate within ЎА1,5% for the same material packed at 1.0 g/cm3. Therefore for this study a value of 1385 cal/g is assumed for the explosive. Thus all charges of 0.150 gram used here provide chemical energy available for, cratering equal to 8,7 * 109 ergs. This energy is equal to the kinetic energy of the aluminum projectiles that produced the impact craters. The detonation pressure is also equal to the pressure behind the shock wave produced in the sand at the time of impact. In order to insure that explo-sion of the bridge wire did not contribute significantly to cratering, the wire was exploded in sand several times. Cratering was not observed. A series of trial cratering experiments was also performed to demonstrate that the target containers used were large enough to prevent edge effects that might interfere with crater growth. These experiments included measurement of crater dimensions in target containers much larger than those routinely used and observation of control markers beneath craters formed in the standard target containers. No interference effects were observed.
Measurements of Cratering Effects
Impact-cratering data obtained in this study show that for impact craters formed in sand targets at, constant velocity, crater volume depends on the kinetic energy of the impacting body raised to some power between 0.75 and 1.0 depending on impact velocity. Most interpretative studies of large impact craters have also assumed that kinetic energy is important in determination of crater dimensions. For explosion craters, size depends on the total yield of chemical energy of the explosive, detonation pressure, and depth of burst of the charge. Thus apparent crater diameter is an obvious cratering effect to be measured in simulation of impact crater formation at a given kinetic energy by detonating explosives of a given yield that are buried at different. depths. For craters formed in sand, crater shape depends on the impact velocity. Because the velocity has been controlled in this experiment, crater shape is an important cratering effect to be observed. Both size and shape of impact and explosion craters have been determined by obtaining two profiles passing through each crater center and intersecting at an angle of 90Ўг. For each profile of each explosion and impact crater, a rectangular coordinate system was superimposed on the profile so that the coordinate (0, 0) was at the crater bottom. For each interval of +X and ЎЄX of 1 cm, the Y coordinate of intersection with the crater wall was determined. For all impact craters and for all explosion craters formed at the same depth of burst, the mean and two standard deviations of each of these coordinates were determined and an average profile was constructed. These profiles are the data for determination of which depth of burst simulates impact on the basis of crater size and shape. The details of the growth of impact- and explosion-crater ejecta plumes have been determined in this study from study of high-speed motion pictures of cratering events. The nature of the ejecta growth for explosion craters is related to chemical energy, detonation pressure, target shock-wave geometry, and depth of detonation. For those events where the charge is deeply buried, the ejecta grows as an expanding bubble that finally is vented before material falls back into the crater. This ejecta-growth pattern reflects the presence of both the spherical shock wave and the expanding gas ball, which is characteristic of craters produced by deeply buried charges. Those explosion craters formed by charges placed at the surface are characterized by growing ejecta fans that are vented at once and never possess bubblelike ejecta plumes. They are similar to the ejecta-plume patterns of impact that arc the surface reflections of hemispherical-shaped shock waves developed in the target by the impacting body. Because ejecta-plume growth is a surface manifestation of energy and target shock-wave amplitude and geometry for impact craters and explosion craters and of depth of detonation for explosion craters, it is considered a definitive cratering effect to be measured for the simulation study.
High-speed motion pictures of ejecta plumes of impact and explosion craters were obtained using a 16-mm high-speed framing camera with typical framing rates of 8000 to 10,000 frames/sec. After a photographic record was obtained, a calibration curve relating elapsed time to photograph frame number was derived from millisecond marks recorded on the film. Those frames, corresponding to times elapsed from impact or explosion of 2, 10, 20, 40, 6O, 80, 100, 120, and 140 msec, were projected for tracing of the eject a plumes at these elapsed times. These times are accurate within ЎА100 §Юsec. The point on the target surface that corresponded to impact for each impact crater and ground zero for each explosion served as the (0, 0) coordinate of a rectangular coordinate system that was superimposed on each of these ejecta-plume diagrams. Then, for fixed vertical intervals, the +A' and ЎЄX coordinates of intersection with the lateral boundaries of the ejecta plumes were determined for each of the ejecta-plume positions at each time interval. The mean and two standard deviations of each of these coordinates were determined for the impact craters and for explosion craters formed at the same depth of burst. The resultant average ejecta-growth patterns can be used for determining which depth-of-burst explosion crater simulates impact.
The magnitude and direction of subsurface deformation that occurs beneath impact craters are a function of both the kinetic energy and the velocity of the body that impacts. This can be realized at once if it is considered that craters formed at higher energy are bigger than those formed at lower energy and that low-velocity projectiles burrow into a target but high-velocity projectiles are fragmented and ejected from the crater. The magnitude and direction of subsurface deformation for explosion craters are also a function of chemical energy. In addition, they depend on depth of burst and probably on detonation pressure. For example, explosion craters formed by charges buried very deeply contain large quantities of mixed fallback material beneath the surface of the crater bottom. The subsurface structure is much different from the subsurface structure of craters formed at shallow depths of burst that contain little if any fallback material. The degree and direction of subsurface particle flow beneath impact and explosion craters reflect the basic mechanisms of the particular condition of crate-ring considered and therefore are important cratering effects to be measured in a simulation study.
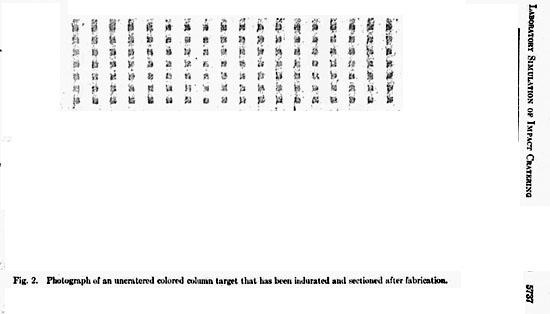
Diehl and Jones [1964] described a tracer technique for observing participate flow beneath large terrestrial explosion craters. The method involves placement of marker cans in colored sand columns in arrays surrounding ground zero. After crater formation, marker cans remaining in the target are located and surveyed when the crater is sectioned. The study showed that a vector diagram could be constructed to connect initial particle position with final particle position for each of the marker positions beneath the crater. This diagram was shown to be similar to a scaled-down plot of the theoretical hydrodynamic velocity vectors calculated by Brode and Bjork [1960] for a megaton surface burst. The method also was useful for showing shear zones and the amount of compaction beneath explosion craters. Their results indicate that the tracer technique is a valuable tool for showing details of the crater-ing mechanism. This technique has been modified for use in small-scale laboratory experiments. Multicolored sand columns are positioned in the loose-sand targets along a transverse 5-cm-thick segment of the target at regular intervals. Each column consists of alternating 6.3-mm-thick red- and blue-colored sand zones. The sand contains 0,16% by weight of powdered epoxy resin. After the crater is produced, the entire target is placed in an oven and baked at 150ЎгC. The indurated target is then cut, and detailed flow beneath the crater can be observed. Figure 2 shows a section of a target that has been cut directly after fabrication and baking. This illustrates the initial position of all discrete colored sections of sand. The horizontal control in positioning each discrete element of colored sand is about the median dimension of the individual sand grains (400 ). Targets such as this provide a valuable tool for determining which depth-of-burst explosion crater simulates the impact crater, because subsurface deformation is intimately related to cratering energy, shock-wave pressure and geometry, and shock-wave decay.

For the impact crater and for each explosion crater, the final positions of each discrete zone of colored sand in a plane passing through crater center have been traced from photographs of the sectioned targets. Comparison of these diagrams will determine which depth-of-burst explosion crater produces subsurface deformation similar to that produced by impact.
Experimental Results
Explosion-crater profiles and impact-crater profiles. Figure 3 shows a series of average pro- files in black, each of which represents orators produced by charges detonated at the same depth. Each of the first four profiles of Figure 3 represents the average profile of six craters formed at one of four different specified depths of burst less than or equal to 9.5 mm ± 1 mm. The average profiles for those craters formed at depths of burst greater than 9,5 mm ± 1 mm represent the average profiles of only four craters produced at each depth of burst. The profiles of all explosion craters of Figure 3 are superimposed on the average grey profile of six craters formed by impact of cylinders of 2024 aluminum.
Study of profiles of the explosion craters shows that as charges are buried at greater depths, the crater becomes larger. At greater depths of burst, coupling between the explosive and target material is better than for shallow depths of burst, where gas products of the explosion are vented. Crater shape also changes with increasing depth of burst. The crater formed by the surface burst has a nearly spherical segment shape. Those formed at mean depths of burst of 3.2 mm ± 1 mm and 6,3 mm ± 1 mm and 9.5 mm ± 1 mm have crater shapes transitional between the spherical-segment shape and the conical shape. Those craters produced by charges buried at depths of burst greater than 9.5 mm ± 1 mm are nearly conical in shape. The spherical-segment shape of the craters formed at mean depth of burst of 0 mm ± 1 mm is thought to reflect best the geometry of a crater formed predominantly by relaxation of a hemispherical shock wave produced by detonation. At this shallow depth of burst, cratering due to both gas acceleration and target compression is less than for any of the other explosion craters. The main cratering mechanism is the formation of rarefaction waves at the target-free surface, which relaxes the high pressures in the target by accelerating the target material into ballistic trajectories. For craters formed at depths of burst greater than about 9.5 mm ± 1 mm, crater shape is conical as a result of slumping of crater walls. Cratering efficiency has increased enough at these depths that gas acceleration and compaction of target materials form a spherical cavity beneath the target surface during crater formation. The energy available for cratering is sufficient to remove most of the materials set in motion, but some material slides back toward the crater center, forming straight internal crater walls. In addition, as more and more material is set in motion at increasing depths of burst by the expanding gas ball and rarefaction waves, more material falls back into the target. Thus these craters are shallower, and at extreme depths of burst a central peak is sometimes formed from chaotically mixed fallback material.
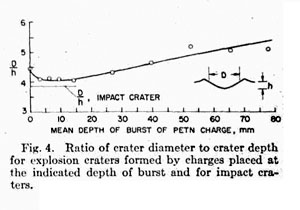
The average profile of the six impact craters also reflects the mechanics of formation. Differences between impact- and explosive-crater formation are that there is no formation of a gas ball for impact cratering, and a hemispherical shock wave is formed, rather than the spherical shock wave that, is formed in craters produced by deeply buried explosive charges. Thus the profile of the impact crater matches the profile of the shallow - depth-of-burst explosion crater with mean depth of burst of 0.3 mm ± 1 mm. For this event, the gas ball vents early in cratering, and the shock-wave geometry must approximate the impact -produced shock waves because its source is near the target surface. The crater with a 0-mm mean depth of burst fails to simulate the formation of the impact crater mainly because the crater is too small, owing to poor coupling between the explosive charge and the target. Figure 4 shows a plot of diameter-to-depth ratios for craters produced by various depths of burst of the charge and for the impact craters. The diameter-to-depth ratio of the 0-mm mean-depth-of-burst explosion crater is considerably greater than the ratio for the impact craters. This reflects poor coupling between charge and target; there is less compression beneath the target for the surface-burst crater than is present beneath impact craters. Diameter-to-depth ratios of explosion craters formed at depths of burst between 3 mm and 14 mm are the same and are most similar to the diameter-to-depth ratio of the impact craters. Because the ratio is the same for a large range in depth of burst, diameter-to-depth ratio is an insensitive criterion for simulation. Inspection of the average profiles of impact craters and explosion craters indicates that the charge buried at mean depth of burst of 0.3 mm ± 1 mm produces a crater that exactly matches the size and shape of the impact crater.
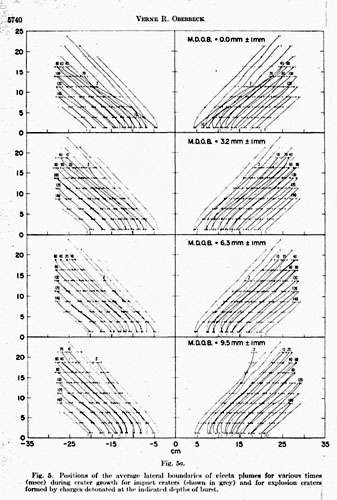
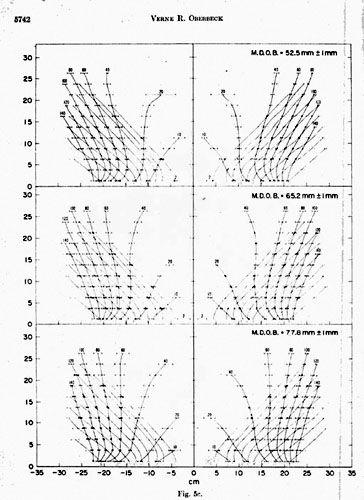
Ejecta plume diagrams for the impart craters and the explosion craters. Figure 5 shows the mean boundaries of the ejecta plumes at specified elapsed times from impact or detonation for impact craters and explosion craters formed by charges detonated at a given depth of burst. For each event, each set of ejecta positions for the elapsed times shown is the average position of the ejecta plumes. The horizontal flags show two standard deviations of the lateral positions of the ejecta plume for each of the specified times. Diagrams showing the ejecta-growth pattern in black for explosion craters formed at all depths of burst are superimposed on the diagram showing the average ejecta-plume-growth pattern of the impact crater, which is repeated in the figure in grey.
Those explosion craters formed by deeply buried charges (>27.0 mm ± 1 mm) all exhibit bubblelike ejecta plumes, especially early in the cratering events. For example, the shape of the ejecta plume for the explosion crater with a 27.0 mm ± 1 mm mean depth of burst is domelike 2 msec after detonation. For craters produced by charges buried at depths of burst greater than 27.0 mm, the bubble persists for longer and longer periods of time. Formation of the bubble is due to the combined effect of the spherical shock wave and the accelerating spherical gas ball. Disappearance of the bubble late in the cratering event coincides with venting of gases above the target surface. The bubble persists later in cratering for deeply buried charges than for shallow depths of burst because there is more material set in motion in near-vertical trajectories. All explosion craters characterized by bubble-shaped ejecta plumes (those formed at depths of burst greater than or equal to 27 mm) do not simulate the effects of impact cratering because impact-crater ejecta plumes never have this appearance. The explosion crater formed by a charge at the 0-mm mean depth of burst does not possess a bubble-shaped ejecta plume at any time during the event because the products of the explosion vent at once, and the shock-wave geometry in the target is approximately hemispherical. However, for these craters, the slopes of the lateral boundaries of the ejecta plumes are less than for impact. Those explosion craters formed at intermediate depths of burst also vent very soon after impact, but coupling between target and explosive is better, as evidenced by greater crater size.
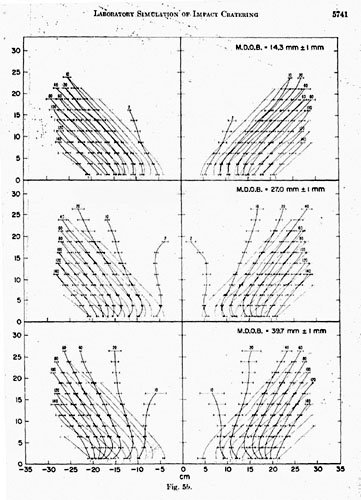
Study of all of the diagrams of average ejecta positions at the indicated elapsed times from impact and explosion shows that none of the patterns of ejecta growth of the explosion craters formed at the indicated depth of burst exactly duplicates the pattern of ejecta development of the impact crater. The explosion craters that exhibit an ejecta-growth pattern most like that of impact on the basis of positions of the ejecta-plume lateral boundaries are those formed by the charge detonated at a mean depth of burst of 6.3 mm ± 1 mm. The pattern differs from the ejecta pattern of the impact crater only because the positions of the lateral boundaries of the plume are translated further from the point of detonation for the explosion craters. The difference is less for craters produced at this depth of burst than for any other depth. However, the slopes of the ejecta-position boundaries of the explosion crater formed by the charge placed at a depth of 9.5 mm ± 1 mm are most similar to those of the impact crater. Figure 6a shows a plot of the slopes of the straight portions of the ejecta envelopes as a function of time in milliseconds for the diagrams of the impact-crater ejecta plumes and for each of the explosion-crater plumes. The slopes of the ejecta boundaries late in cratering are most like those of the impact event for the crater produced by the charge buried at 6.3 mm ±1 mm. However, Figure 6 shows that the sum of the squares of the deviations of the slopes of the ejecta plumes of the explosion craters from the slopes of the ejecta plumes of the impact crater for all ejecta-plume positions is less for the explosion crater with a 9.5 mm ± 1 mm depth of burst than for any of the other explosion craters.
Subsurface particle flow for the impart craters and the explosion craters. Deformation produced beneath the explosion craters and impact craters formed in quartz sand has boon studied by using special targets containing colored columns of sand. An uncratered target indurated directly after fabrication is shown in Figure 2. A section through an impact crater is shown in Figure la. Deformation beneath the crater is characterized by appreciable compression. This can be confirmed by tracing the discrete elements of sand near the bottom of the target across the target. Examination of the area beneath the crater shows that the direction of net particle flow grades from radial beneath the impact point to tangential near the crater rim. Beneath the crater, at intermediate positions, the flow is nearly horizontal, and it is directed away from the crater center. Subsurface flow for the impact crater is always downward near the crater center.
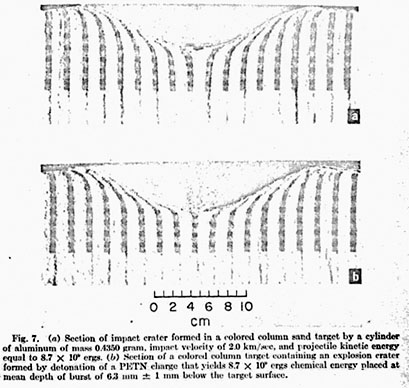
The vertical component of flow becomes positive away from the crater center. There never is a horizontal component of flow that is directed toward the crater center for the impact crater. However, horizontal components of flow directed toward crater center do occur for some explosion craters produced by deeply buried charges. Figure 7b shows a section of a target containing an explosion crater formed by a charge placed at mean depth of burst of 6.3 mm ± 1 mm, which is the depth-of-burst explosion crater found to simulate the impact crater on the basis of size and shape and ojecta-plume growth. The deformation pattern beneath this explosion crater is remarkably similar to the deformation pattern beneath the impact crater of Figure 7a. The same radial compression beneath the crater center is noted, and there is a positive horizontal component of particle flow beneath the sidewalk of the crater, as well as a positive vertical component of flow near the crater rim. Deformation patterns beneath the explosion craters formed at greater mean depths of burst are much different, containing chaotic mixing structures and slump structures. These features are caused by fallback of the material with low initial velocities that produce the domelike ejecta-plume patterns discussed earlier. Positions of the discrete elements of colored sand in the sections of targets of all explosion craters and the section of the target containing the impact crater have been traced from photo-graphs similar to those of Figure 7. These diagrams are presented in Figure 8.
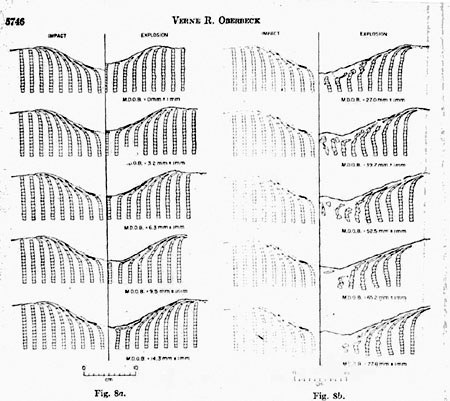
Tracings of half-sections of the impact crater are repeated in the left half of the figure in a grey tone. Half-sections of explosion craters formed at various depths of burst are shown in black on the right half of the figure. Inspection of the sections shows a continuous variation of structure for. the explosion craters as the charge is buried deeper and deeper. Deformation of the discrete elements of colored sand beneath the 0-mm and 3.2-mm depth-of-burst explosion craters is similar in direction to that observed beneath the impact crater, but magnitude of particle flow is less for these craters than for the impact crater. The magnitude and direction of particle flow beneath the explosion crater with a 6.3 mm ± 1 mm mean depth of burst exactly match the magnitude and direction of flow beneath the impact crater. Deformation of the discrete colored-sand elements beneath the explosion craters formed at mean depths of burst greater than 6.3 mm ± 1 mm differs in direction and magnitude from those observed beneath the impact crater. For example, the explosion craters formed at mean depth of burst, equal to 9.5 mm ± 1 mm contain a nearly horizontal component of flow near the crater bottom, and the crater formed at a mean depth of burst of 14.3 mm ± 1 mm is characterized by slight slump structures that occur as recurvatures of the colored columns toward crater center near the crater wall.
As charges are buried deeper and deeper, the tendency for slumping increases until the extreme mixing and slump structures develop that are similar to those of explosion craters produced by charges at 52.5 mm ± 1 mm mean depth of burst. It is concluded on the basis of study of subsurface deformation exhibited by the diagrams of Figure 8 that the explosion crater with a 6.3 mm ± 1 mm depth of burst is characterized by subsurface deformation exactly the same as that observed beneath the impact crater. Discussion It has been demonstrated in this study that, on the basis of crater size and shape and subsurface structure, impact craters formed in the laboratory by impacting cylinders of 2024 aluminum of mass 0.4350 gram against a quartz-sand target, with impact velocity equal to 2.0 km/sec and impact kinetic energy of 8.7 X 10⁹ ergs, can be simulated by detonation of a Fig. 8.
Diagrams showing the final positions of discrete elements of colored sand beneath an impact crater and explosion craters produced by charges placed at different depths of burst. Flow beneath the impact crater is shown by the repeated diagram on the left of the center line, which is for one half of the impact crater. Half-sections of the explosion craters found at different depths of burst are shown on the right of the center line.
The explosion crater produced by the charge placed at burst depth of 6.3 mm ± 1 mm provides the best simulation of flow observed beneath the impact crater. 0.150-gram charge of the high explosive PETN, which yields chemical energy equal to the kinetic energy of the impact event, if the mean depth of burst of the charge is equal to 6.3 mm ± 2 mm. Ejecta-plume-growth patterns of explosion craters formed at 6.3 mm ± 2 mm and 9.5 mm ± 1 mm are most similar to those of impact craters. Since crater size and shape and structure are of primary interest, it is concluded that impact is simulated by the 6.3mm ± 2 mm explosion crater. For purposes of demonstration only, it can be assumed that dimensions of explosion craters scale according to the cube root of the charge weight of TNT in pounds. If this is assumed, and if the charge weight of PETN used in these experiments is converted to equivalent weight of TNT, the results of this study show that explosion craters formed at scaled depths of burst equal to h/W1/3 = 0,26±0,10 simulate formation of impact craters. In this ratio, h is the mean depth of burial of the explosive charge in feet and W is the weight in pounds of TNT. Choice of any other exponent for would, of course, yield a different value for the scaled depth of burst required to simulate impact. Caution must be used in using explosion craters formed at scaled depth of burst, of 0.20 ЎА 0.10 as analogs for calculating conditions of formations of impact craters. In addition to the uncertainty of the selection of the exponent of W that should be used [Sun, 1970], there is a more serious difficulty that may cause error when explosion craters are used as analogs for estimating the kinetic energy and other conditions of formation of a given impact event on the basis of impact-crater size and explosion-crater size and yield. Laboratory results indicate that without knowledge of either impact, velocity or projectile mass, which usually cannot be obtained in nature, kinetic energy cannot be estimated from crater size alone.
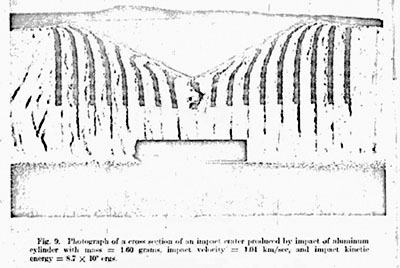
Projectiles of different velocity but with the same kinetic energy produce craters of different size in quartz sand. High-velocity projectiles deposit a larger fraction of projectile kinetic energy as heat in the target than that produced by low-velocity impacts, and the dynamic target strength is higher for impact at high velocity than for impact at low velocity. Thus less energy available to do work against higher strength produces a smaller crater. Therefore calculation of kinetic energy of a meteoroid that produces a given impact crater would require knowledge of impact velocity. This knowledge would permit selection of the scaled depth of burst explosion crater that simulates impact at that velocity. An equation expressing crater diameter in terms of energy yield for that scaled depth of burst could then be used to compute projectile kinetic energy. Error would be introduced in such a calculation by any uncertainty in the value of impact velocity for the impact crater being simulated. Impact craters formed by projectiles with the same kinetic energy but different projectile velocities display different subsurface flow as well as a difference in size. Figure 9 shows a photograph of a cross section of a crater produced by an aluminum projectile with the same kinetic energy of 8.7 * 109 ergs as the impact crater simulated by the explosive charge, but the projectile mass was 1.60 grams and the impact velocity was 1.04 km/sec. The mass of the projectile used in the simulation study was 0.4350 gram, and the impact velocity was 2 km/sec. A photograph of the section of the crater produced at 2 km/sec is shown in Figure la. The structures beneath these two craters are very different. For the crater of Figure 9 formed by the larger projectile at the lower velocity, the projectile burrowed into the target and entrained target material behind it. This can be confirmed by observation of the colored columns of sand that curve inward behind the projectile in the target shown in Figure 9.
The projectile of mass 0.4350 gram that produced the crater shown in Figure 7a did not penetrate beneath the crater bottom, and the subsurface structure is different. Crater shape is also different, and the crater is 20% smaller than the crater produced at lower velocity. The cause of the decrease in impact-crater size with increasing velocity for constant projectile kinetic energy may not be known with certainty, but, because it occurs, there may be error in using explosion-crater analogs to estimate the conditions of formation of terrestrial impact craters, including the projectile kinetic energy. Had this effect not occurred the procedure that would be used to determine the kinetic energy of the projectile that forms any given terrestrial impact crater would be straight forward. The results of this study have shown, assuming cube-root scaling for explosion craters, that explosion craters formed at scaled depths of burst of 0.26 ± 0.1 simulate impact-crater formation at 2 km/sec. Thus kinetic energy could be computed from crater diameter alone from equations such as those presented by Baldwin [1963] for explosion craters produced at scaled depth of burst equal to 0,26 ± 0.1. But, it has been shown that two impact craters produced by projectiles with the same kinetic energy but different impact velocity are of different size.
Use of an explosion-crater analog with a 0,26-mm scaled depth of burst would therefore yield variable estimates of projectile kinetic energy for these craters. The magnitude of the error involved would depend on the degree of difference in impact velocity of the natural event from 2 km/see. Since impact velocity for natural events is typically unknown, it is difficult to evaluate this error. However, it is not likely that the error would be large because most terrestrial craters have probably been produced by bodies impacting at velocities well in excess of 5 km/sec. Although the velocity effect is still present at 5 km/sec, the difference in crater size due to a difference in impact velocity for a given projectile kinetic energy is very small for velocities greater than 5 km/sec. More exact solutions for kinetic energy of bodies producing terrestrial impact craters will require experimental knowledge of the exact scaled depth of burst required to simulate impact craters formed at higher-impact velocities.
Acknowledgmets.
The experimental results reported here could not have hern obtained without the combined and continuing efforts of many individuals. I thank Mr. John Wedekind for aid in developing and performing many of the experiments. The services of Mrs. Anna Hood and Mr. Mike Lovas in reducing some of the data arc also acknowledged. Mr. Andre Bogart and Mr. Robert Reresford contributed to the development of the sand targets used for the study of subsurface deformation. Special acknowledgement is made to Mr. Anthony Quartuccio, who has carefully and precisely assembled these targets. This publication is part of a series of publications resulting from a symposium held at the Lunar Science Institute, Houston, Texas.
References
Baldwin, R. B., The. Measure of the Moon, 488 pp., University of Chicago Press, 1963.
Braslau, D., Partitioning of energy in hyper- velocity impact against loose sand targets, J. Geophys. Res., 75, 3987-3909, 1970.
Brode, H. L., and R. L. Bjork, Cratering from a megaton surface burst, 53 pp., Rand Corp., RM 2600, 1960.
Cook, M. A., The Science of High Explosives, 440 pp.. Reinhold, Now York. 1968.
Diehl, C. H. H., and G. H. S. Jones, A tracer technique for cratering studies. J. Geophys. Res., 10, 305-309. 1964.
Mark. F., J. McKolter. Jr.. F. Othmer, and A. Stutden, Eds.. Kirk-OtInner Encyclopedia of Chemical Technology, 2nd ed., vol. 8, pp. 581- 719, Intorscience, New York, 1965.
Shoemaker, E. M., Penetration mechanics of high Velocity meteorites, illustrated by Meteor Crater, Arizona, 21 si Int. Geol. Congr., Norden, 1960, Rep. Session, part 28, pp. 418-434, Copenhagen, 1960.
Sun, J. M. S., Energy counter-pressure scaling equations of linear crater dimensions, J. Geo-phys. Res., 75, 2003-2028. 1970.
Van Thiel. M., A. S. Kasuboo. A. C. Mitchell, and V. W. Davis, Eds., Compendium of Shock Wave Data. UCRL 60108, vol. 1, see. A-2. Lawrence Radiation Laboratory, Livermore, Calif., 1966 (Received January- 18. 1971; revised March 11, 1971.)